into Profits with a Spreadsheet
The Guide to Maximizing Customer Marketing ROI
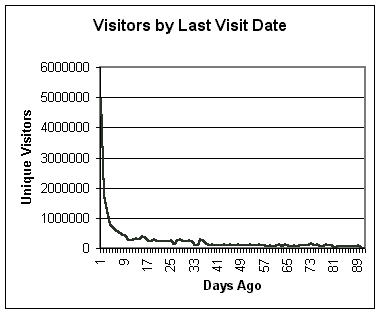
Predictive Modeling of Customer Behavior - Drilling Down in ActionThe likelihood of a customer to repeat an action (purchase, visit, game play) relative to other customers can be predicted using a customer LifeCycle metric known as Recency. Recency is defined by the number of days or weeks since the customer has performed the action (purchase, visit, etc.) you are profiling. The more Recently a customer has engaged in an action, the more likely they are to repeat the action, especially when encouraged to repeat by some kind of promotional effort. Above is a graph of customer Recency (time elapsed since last activity) based on last visit (or page view) date. The number of unique visitors is on the left (y-axis) scale; the number of days since last visit (or page view) on the bottom (x-axis) scale. This site has about 5 million unique visitors a month. "Yesterday" is at the far left of the chart – 1 day ago; the right of the chart is 90 days ago. Customers are plotted by the number of days since
their last visit (page view). For example, all the customers
who last visited If your answer is these guys have a great business, you’re right. I mean, they have 5 million monthly uniques TOTAL, and most of them visited YESTERDAY. Not only that, but virtually ALL of them have visited in the last 10 days! This is a smokin’ business. But you wouldn’t know that without looking at Recency, would you? You have to know this stuff. It means something very important, not only to marketing, but also to the value of your business in the future. Now
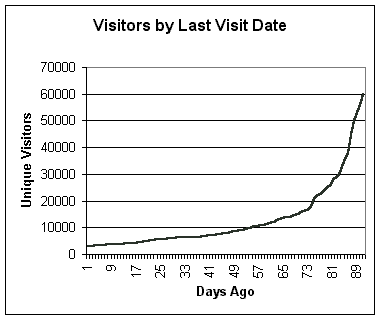
take a look at this second graph below.
Once again, a graph of customer Recency, based on last visit (page view) date. Unique visitors are on the left (y-axis), and days since last visit (page view) on the bottom. Yesterday (1 day ago) on the far left, 90 days ago on the far right. This is a smaller site. They launched with about 60,000 uniques 90 days ago, but only about 3000 a day come back now. What’s the future of this business? What’s the data say to you about it? It’s toast, man.
Absolutely moribund. They’ll
be lucky to keep the visitors they have. They
need to make major changes, and I hope they have the e-mail addresses of those
people who never came back so they can promote their new offering.
If they don’t, there’s not much hope. These two businesses didn’t just magically get to where they are overnight; there was a process; customer behavior changed over time. Wouldn’t it be great if there was a way you could track this process, a way to know the direction your business is headed? There is, and you can learn about this method and many others for tracking and managing customer value in the Drilling Down book. |
|
|
|
Slow connection? Same content, less graphics, think Jakob Nielsen in Arial - Go to faster loading website Contact me
(Jim Novo) for questions or problems with anything on this web site.
| |
![]()
|
Get the book with customer scoring software at Booklocker.com Find Out Specifically What is in the Book Learn Customer Marketing Concepts and Metrics (site article list)
|
|
|


