into Profits with a Spreadsheet
The Guide to Maximizing Customer Marketing ROI
|
Site Map | |
|
Workshops,
Project Work: Retail Metrics & Reporting, High ROI |
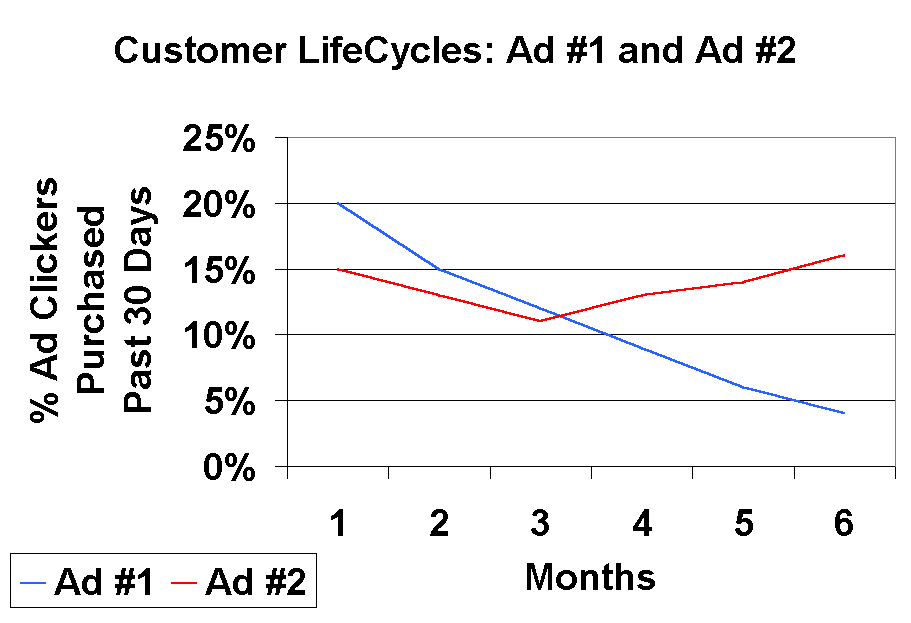
Adding Customer LifeCycles to the Mix(a.k.a. CLM / Customer LifeCycle Management and CRP / Customer Relationship Planning, if you didn't know. This is getting silly.) Jim's Note: This is your second model for comparing the potential value of customers. You are building on the first model by adding the element of time, improving accuracy. You may have noted in the beginning of the previous example I specified the ads you were comparing should have "run at the same time, for the same duration." Do you know why? Customer LifeCycles. It's not fair to compare the customer Recency percentage of an ad that ran 90 days ago with an ad that ran 30 days ago, because customers tend to leave you over time. You learned this in the previous model. If one ad has more time to "lose customers," then comparing them would be unfair or biased by the element of time. This tendency of customers to leave over time has different names depending on the business model - some call it attrition (credit cards), it is an element in churn (cable, long distance, wireless), and in retailing and database marketing it is often called defection. You can compare ads having different start points, as long as they're not so far apart that seasonality comes into play (comparing ads that ran in July with those that ran during November, for example). This is done by matching up the LifeCycles - a Recency analysis at the same point in the cycle. If you want to compare the potential value of an ad running 30 days ago with one running 90 days ago, you have to look at the Recency of the 90 day ago ad 30 days after it ran to take out the LifeCycle effects. Using the previous example, if Ad #2 ran 90 days ago, you would want to find out what percentage of people who clicked on Ad #2 took action 30 days after it first ran. If you always run your analysis referencing the start date of an ad (or any other variable you are measuring), and measure for equal time periods after the start date, you will eliminate most of the LifeCycle effect and can compare the results fairly. So what about these LifeCycles, is there a way this information can be tracked and used? Well sure; using LifeCycles can solve the little problem we left at the end of the previous tutorial page. Thinking about the Ad #1 and #2 example, what if you repeated the Recency query for each ad (made at least one purchase in the past 30 days) every 30 days for 6 months? What would you get? You would have a series of measurements looking at the potential value of the customers generated by the ads over time. You would be able to chart the defection patterns of Ad #1 and Ad #2 customers. Why is this important? Because if you want to get at the true value of the customers generated by the ads, you have to measure their value over the LifeCycle. You might be surprised. Take a look at the chart below from our previous example: Top to bottom on the left side of the chart is the percentage of customers making a purchase in the past 30 days; left to right at the bottom of the chart are the months each Recency analysis was performed since the start date of the ad campaigns. Both the Ad #1 (blue) and Ad #2 (red) lines start at the percentages we came up with in the Recency of purchases analysis on the previous page. Recency Percentage Over Time
Ad #1 Starts with Higher Recency, If you look at the chart above, you can see that Ad #1 (blue line) starts at 20% of customers having purchased in the past 30 days, and in 6 months, falls to less than 5%. Ad #1 also seems to be headed even lower in Recency; these customers are losing even more potential value as time goes on. Ad #2 (red line) starts at 15% of customers having purchased in the past 30 days and falls into month 3, but then starts rising in later months, ending up higher than it started, and is still rising. Customers from Ad #2 might end up having greater potential value than customers from Ad #1 over the longer term. So it could be that, after looking at the LifeCycle of customers from Ads #1 and #2, you may find even though Ad #1 looks best based on Recency at a point in time, Ad #2 creates higher potential value customers when Recency is looked at over time. In looking at the
LifeCycles, we have perhaps come up with a clue to the behavior we saw in
the Recency of visits analysis on
the previous page. It would appear that the customers from Ad #2 may
take a little longer to make a purchasing decision, but become more
valuable customers over the long run. This is a very common
occurrence in customer behavior and if you are not tracking it, you won't
know it is happening, leading to poor decisions about the profitability of
your ad campaigns. Next in Tutorial: Read
advanced version of this model |
|
|
|
Slow connection? Same content, less graphics, think Jakob Nielsen in Arial - Go to faster loading website Contact me
(Jim Novo) for questions or problems with anything on this web site. You're in the middle of a
short tutorial on comparing the potential value of customer groups. | |
|
You're in the middle of a
short tutorial on comparing the potential value of customer groups. If you would like to take the tutorial from the beginning, click here. |
|
Find
Out Specifically What is in the Book
Learn Customer Marketing Concepts and Metrics (site article list)
|
|
|

